Social and Spatial Flood Risk Analysis for Decision Making: Cases from Two Flood Prone Areas in Eastern Sudan
1.1 Extreme climate-related shocks and disasters in Sudan
1.3 Impact of flooding on people and livelihood
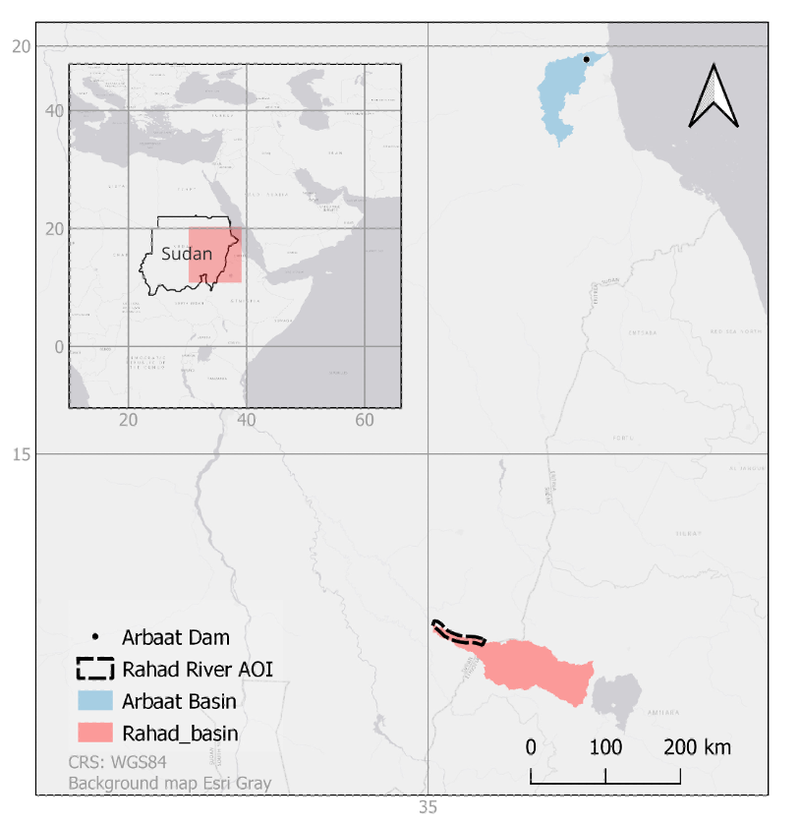
Figure 1: The location of the two study areas
Table 1: Overview of datasets used and their main characteristics
4.1.3 Impacts and consequences of floods
4.1.4 Mitigation and coping measures undertaken in the affected villages
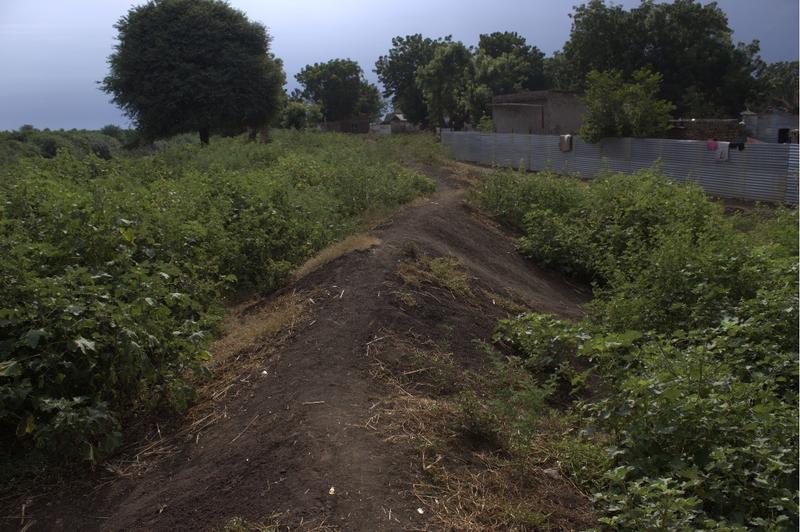
Figure 8: Earth terrace in Afrush Tobak village built in 2022 to protect the village from the flood.
4.2.3 Impacts and consequences of floods
4.2.4 Mitigation and coping measures undertaken in the affected villages
How to cite this publication:
Hussein M. Sulieman, Gidske Leknæs Andersen, Mohamed Talib (2024). Social and Spatial Flood Risk Analysis for Decision Making: Cases from Two Flood Prone Areas in Eastern Sudan. Bergen: Chr. Michelsen Institute (Sudan Report SR 2024:01)
Acknowledgments
The authors very much appreciate the kind support of the community leaders from Rahad River area and Arbaat during the different phases of the fieldwork. The authors also would like to appreciate and thank the informants from both communities for agreeing to participate in the focus group discussion and the key informant interview. Special thanks go to Dr. Ali Berek for joining the fieldwork. This research (Project no. 21044) is part of the Sudan-Norway Academic Cooperation (SNAC) programmme, which is funded by the Royal Norwegian Embassy in Khartoum.
Summary
This report discusses the impact and characteristics of floods in Sudan, focusing on two specific areas: the Rahad River in Gadarif State and Khor Arbaat in Red Sea State. The study uses social surveys, field surveys, and remote sensing data to analyze flood impacts. Key informant interviews and focus group discussions were conducted to gather information on livelihood activities, flood impacts, and community coping mechanisms.
The Rahad River, a tributary of the Blue Nile, experiences significant seasonal flooding which affects villages along its course. The Khor Arbaat area is crucial for providing water to Port Sudan. A dam was constructed to improve water supply resilience, but it has led to sedimentation and displacement of villages. Flooding in this area is influenced by both summer and winter rains. Spatial data and analysis were used to map topographical and hydrological conditions, as well as flood impacts on agricultural and residential areas. The study utilized various datasets, including satellite imagery, to assess flood occurrences and effects.
The report discusses the challenges faced by communities in flood-prone areas in eastern Sudan, emphasizing the multifaceted impacts of flooding, coping strategies, and the need for improved flood risk management. It highlights the severe impact of flooding on agriculture and livelihoods in the study areas, as well as the coping strategies employed by local communities. The communities have developed coping strategies, but the lack of early warning systems and inadequate resources limits their effectiveness, highlighting the need for external support and capacity building. The use of spatial data in the report provides valuable insights into the extent and frequency of flooding, emphasizing the need for targeted interventions in affected zones. The findings underscore the importance of integrating local knowledge and spatial data in flood risk management. Additionally, the report offers further conclusions on specific topics, such as vulnerability and impact, coping and adaptation, livelihood disruption, and recovery and future strategies in flood-prone areas.
The recommendations for decision-makers in the report focus on improving flood management and mitigation strategies. Here are some key points from the recommendations (cf. 6. Recommendations):
- Early warning systems for riverine and flash floods.
- Infrastructure improvements including better drainage systems and flood defenses.
- Community preparedness and coping mechanisms through education and resources.
- Proper and sound relocation of vulnerable communities and reassessing land use planning taking into account issues such as customary land tenure.
- Integrated water resource management to reduce flood risk.
- Enhanced monitoring and data collection for accurate risk assessments.
- Support for agriculture and pastoralism to recover from crop and livestock losses.
- Improvement of health and sanitation infrastructure to prevent outbreaks during and after floods.
- Holistic recovery approach to address economic hardship and ongoing conflict.
- Utilizing spatial and topographic analyses to tailor mitigation strategies for flood-prone areas.
These recommendations aim to address the immediate and long-term challenges posed by flooding in Sudan, while also considering the current socio-political context and enhancing the resilience of affected communities. Overall, the report emphasizes the need for comprehensive flood risk management strategies in Sudan, considering the dynamic and spatial characteristics of flood impacts, especially in the context of ongoing climate changes, socio-economic challenges, and the ongoing conflict across the country.
1. Introduction
1.1 Extreme climate-related shocks and disasters in Sudan
Extreme climate-related disasters, like droughts and floods, significantly impact Sudan meaning the country faces a double threat from water scarcity and flooding. The country's low coping and adaptive capacities make it one of the most vulnerable countries in the world to climate variability and change (GFDRR, 2021). As temperatures are expected to increase and precipitation patterns become more variable, climate-related shocks will likely become more frequent and intense. Potential impacts of this include reduced pasture and water for livestock, loss of arable land, decreased crop yields, and water supply shortages, and ethnic and social conflicts over land and resources (GFDRR, 2021). Over the past few decades, climate variability has already put stress on the region's rainfed agriculture and pastoralist systems, which are the primary livelihoods in rural areas (GFDRR, 2021).
Flooding in Sudan has increased in recent years, and this trend is likely to continue (Elagib et al., 2021). The types of floods faced in Sudan are localized floods from heavy rains, and floods from Nile overflow (Tohami, 2019). The recent floods in Sudan have been linked to the Indian Ocean Dipole and El Nino–Southern Oscillation, which, combined with global warming, has led to more frequent and severe flood events. Changes in rainfall patterns in central Sudan have also been observed, with varying trends in different regions (Elagib et al., 2021).
1.2 Flood types in Sudan
Flood events in Sudan can be categorized into several types based on their causes and characteristics: riverine floods, flash floods, urban floods, and dam flooding. The predominant type is riverine floods which occur when rivers overflow due to excessive rainfall upstream. The Nile River and its tributaries are the main rivers causing such floods in Sudan. Seasonal heavy rains, especially during the rainy season from June to September, contribute to riverine flooding.
Flash floods are caused by heavy rainfall over a short period of time and are sudden and intense (Tohami, 2019). Flash floods are more common in arid and semi-arid regions of Sudan, where the ground cannot absorb the sudden influx of water quickly enough.
Urban areas in Sudan, particularly in the capital city of Khartoum, experience flooding due to inadequate drainage systems and poor urban planning. Heavy rains can overwhelm the drainage systems, leading to waterlogging and flooding in streets and residential areas.
The release of water from dams and reservoirs sometimes occurs downstream from the dam and can be caused by operational or structural failures (Elagib et al., 2021). This type of flooding can affect communities living near or downstream from these dams.
Understanding these different types of floods is crucial for effective decision-making and in developing sound mitigation strategies that minimize the impact on communities and infrastructure in Sudan. For example, early warning systems for riverine floods can be more predictable, while flash flood risks require improved monitoring and community preparedness.
1.3 Impact of flooding on people and livelihood
In recent years, Sudan has faced some of the most severe and devastating flooding in decades. The scale and impact of these seasonal floods has been unparalleled. Furthermore, the floods occurred during a time of economic crisis and political instability. With a significant portion of Sudanese people living in rural areas and relying on agriculture, animal husbandry, and pastoralism, the destruction of crops and livestock has greatly affected the livelihoods of those living in the flooded areas (GFDRR, 2021).
The flood events cause substantial damage to villages, urban areas, and agriculture, leading to population displacement and underdevelopment (Tohami, 2019). Floods also exacerbate health risks, increasing the spread of infectious diseases through water contamination and overcrowding during displacement (Babiker and Pal, 2022).
The 2022 flood in Sudan was one of the most severe events and affected 314, 500 people. The effects of recent flooding have been vast, hitting 16 of Sudan's 18 states, with South Darfur, Gadarif, Central Darfur, White Nile, and Kassala being worst hit (OCHA, 2022). Overall, the 2022 floods had devastating effects on rainfed agriculture and smallholding farmers in Sudan, exacerbating existing vulnerabilities and highlighting the need for effective disaster preparedness and support mechanisms for the agricultural sector (OCHA, 2022).
In July 2024, many areas in Sudan were affected by floods. The impact of floods during the ongoing conflict in Sudan could significantly worsen the humanitarian situation, making coordinated and relief and recovery efforts even more critical. One of the severely affected areas is Arbaat area. In August 2024 the Arbaat Dam collapsed, primarily due to heavy rainfall and flash floods, which overwhelmed the dam’s capacity. The torrential downpours from the region’s seasonal rains exceeded the dam's structural limits, leading to the overflow of water. This event resulted in severe downstream flooding, wiped out villages and left over 60 people dead, with more than 150 missing. The collapse also worsened the humanitarian crisis, displacing thousands and disrupting water supplies to Port Sudan (Reliefweb, 2024). It should be noted that our analysis does not include this event itself.
In a time of multiple crises and economic hardship, exacerbated by the ongoing armed conflict across the country and an increasing number of forcibly displaced populations, the recovery needs, however, go well beyond the immediate flood impacts. Therefore, it is important to consider the dynamic and spatial characteristics of these changes in flood impact analysis when making decisions about the future of infrastructure development, flood mitigation, and response planning for the post-conflict Sudan.
1.4 Objectives
The objectives of this research are to: 1) analyze the spatial and topographic characteristics of two flood prone areas in eastern Sudan – the Rahad River area in Gadarif State and Khor Arbaat area in Red Sea State; and 2) investigate the measures taken by local communities to mitigate the effects of flooding.
2. The case study sites
The study took place in the Rahad river area, Gadarif State and Khor Arbaat area, Red Sea State – two flood prone areas in Eastern Sudan (see Figure 1). In each site, affected villages were surveyed.
Figure 1: The location of the two study areas
2.1 Rahad River
The Rahad River, a tributary of the Blue Nile, originates west of Lake Tana in the Ethiopian Highlands. From there, it flows approximately 480 km into eastern Sudan. In Sudan, the Rahad River merges into the Blue Nile, contributing to the river’s flow. The Rahad River plays a vital role in the hydrology of the region, connecting Ethiopia and Sudan through its flow into the Blue Nile. Southern Gadarif area has a single rainfall season from June to October. The dominant soil type in the area is heavy cracking black vertisol which is relatively fertile and suitable for rainfed crop cultivation.
Figure 2: The Rahad River study area and fieldwork locations. The two overview maps show its location within the river catchment (gray polygon) and in Sudan context.
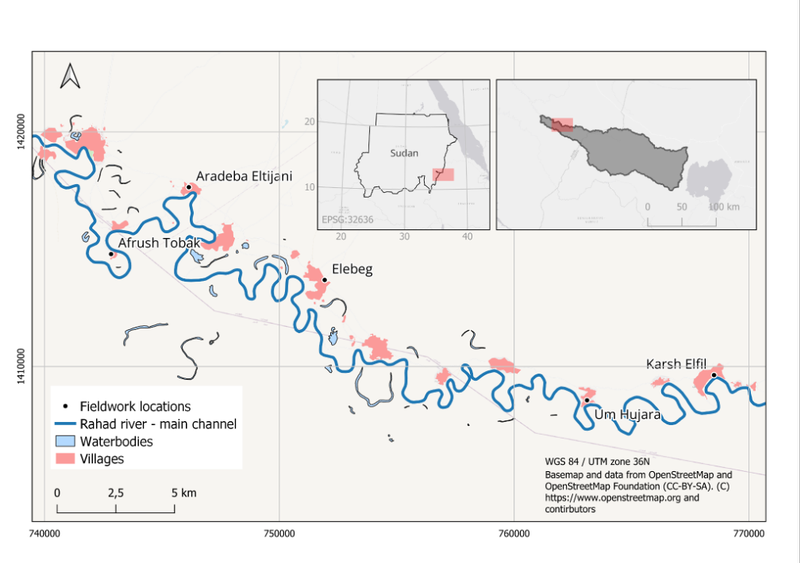
The catchment area of the Rahad River study area is around 9000 km2 (see Figure 2). Our study area is located in the lower part of this catchment, and starts downstream of where two seasonal watercourses join into the Rahad river. From there it stretches around 140 km along the winding river. The landscape is generally very flat along the whole stretch, with an elevation along the river decreasing from c. 500 to 460 m asl (source SRTM data).
The Rahad River’s flow varies significantly throughout the year. Although waterless during the dry season, it has a large flow during the flood season, which is typically from June to September. Water levels rise over a natural levee then recede, leaving water in the side pools and allowing fine sediment to settle. The Rahad River’s seasonal flooding can lead to overbank deposits and changes in the hydrology of the surrounding areas (Hassaballah et al., 2016).
The most recent flood of the Rahad River took place in August 2022, when the river unleashed devastating floods in the southern areas of Gadarif State. Over 45,270 people were affected by these heavy rains and flooding in flood prone areas along the Rahad River in Gadarif State. Ten villages were completely flooded and 42 villages were partially affected (OCHA, 2022), highlighting the vulnerability of riverine communities during the rainy season.
2.2 Khor Arbaat
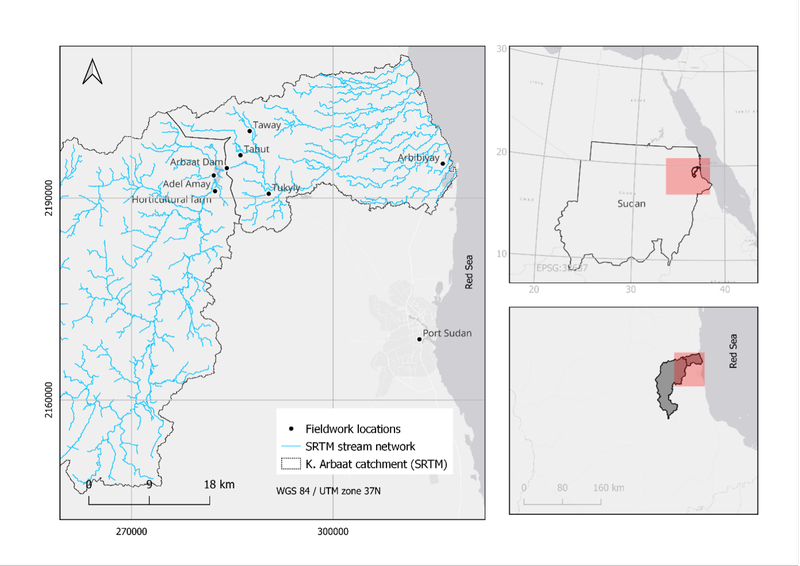
The Khor Arbaat basin (Figure 3) plays a crucial role in providing water to Port Sudan, the capital of the Red Sea State, and its hydrogeological dynamics are essential for sustainable water management in the region. Khor Arbaat is a long valley (more than 180 km) with its roots in the mountains west of Sinkat in the Red Sea Hills where the elevations are around 1100 m asl. It runs northeast to make a delta on the coast, approximately 25 km northwest of Port Sudan Town. The Khor Arbaat basin covers about 4800 km2 and serves as the main source of potable water supply for the domestic use of people in Port Sudan. The water table in the lake of the dam experiences fluctuations during the summer and winter rainy seasons, reaching its lowest level in the dry season.
Figure 3: The Khor Arbaat study area and fieldwork locations. The two overview maps show its location within the river catchment (gray polygon) and in Sudan context.
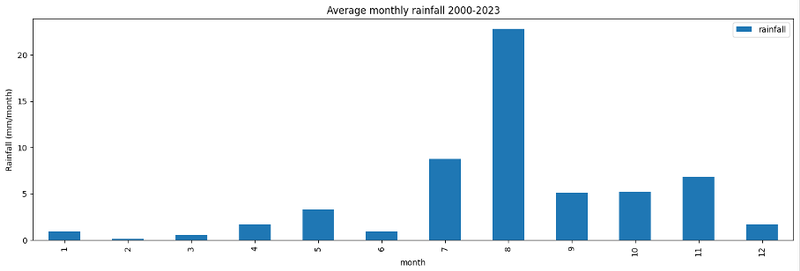
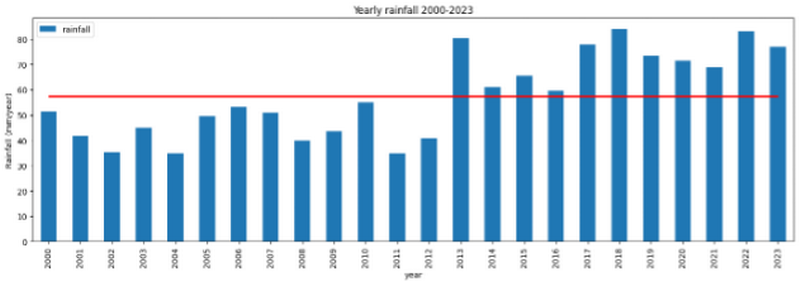
Due to the catchment's location in the Red Sea Hills, it can experience the rainy season in both summer and winter. Summer rains are brought by the southerly monsoon winds and are always falling in the hills and plateaus upstream. The winter rains on the other hand, are brought by the moist north easterly winds and fall on the coastal plain and nearby hills (Figure 4). Due to the arid climate, rainfall is sporadic and irregular. Rainfall can be torrential and due to the large catchments, khors may flood after such events and the amount of water can be harmful to people and their livestock as well as material values.
Figure 4: Monthly and yearly rainfall for the Arbaat catchment extracted from CHIRPS data (see Table 1). Summer rains are most common in July and August, while winter rains have a peak in November. The mean annual rainfall for the period is 57 mm (red line).
In 2000, the Khor Arbaat dam was constructed approximately 40 km northwest of Port Sudan City in the catchment of Khor Arbaat. The catchment area of the dam spans 4,201 km2. Its primary purpose is to enhance water supply services and resilience for Port Sudan City. Despite challenges, such as sedimentation, it remains a critical water resource for the region. By 2020, the dam had lost 69% of its original storage capacity due to heavy sedimentation caused by run off from the catchment area (Ali, 2022). However, the dam remains a critical water resource for Port Sudan, balancing irrigation needs, groundwater levels, and sedimentation challenges (Ali, 2022). While the Khor Arbaat Dam benefitted the area’s water supply, it led to the displacement of many villages and has altered the hydrological conditions across the whole catchment area. The Arbaat Dam in Sudan serves as an example of a top-down approach to infrastructure development, where decision-making and implementation are controlled by centralized authorities, often without adequate consultation with local communities. In Sudan, such approaches have historically overlooked critical local needs, environmental sustainability, and maintenance capacities.
3 Methods
This study relies on a combination of social surveys, field surveys, and multi-temporal multi-sensor remote sensing data sets. This combination is essential to have an in-depth understanding of the contemporary situation in the two flood affected areas in eastern Sudan. It also supports the interpretations of the remote sensing-based findings.
3.1 Social research methods
In both study sites, key informant interviews (KIIs) and focus group discussion (FGDs) were conducted. Topics discussed with informants included main livelihood activities, services and infrastructure, floods events and types, impacts and consequences of flood, coping measures undertaken by the communities and types of interventions needed. The surveys in the Rahad River, southern Gadarif State and Khor Arbaat, Red Sea state were conducted during October 2023 and January 2024[1], respectively.
In the Rahad River area, five villages were covered during the fieldwork: Aradebat Eltigani, Afrush Tobak, Elebeig, Um Hujara and Karesh Elfeel (Figure 2). These villages were the most severely affected by the 2022 flood in the area. A total of 32 KIIs were conducted, and the number undertaken in each village ranged from 5 to 8. The main livelihood in the area is crop farming followed by pastoralism, therefore livelihood was considered when selecting the respondents: of the 32 KIIs, ten were with pastoralists and the rest with farmers. One to two FGD sessions were conducted in each village, one with the farmers and the other with pastoralists. Gender and age were also taken into consideration in the selection of the participants. Due to social norms and barriers, males and females were gathered and interviewed separately.
In Khor Arbaat, almost all villages were affected directly or indirectly by the floods caused by water overflow along Khor Arbaat or the lake of the dam. Interviews were carried out in three groups of villages: coastal villages close to the sea, including Arbibiyay; the middle villages situated below the dam, including Tukwily and Eshanak-Salagibib; and finally, the upstream villages situated above the dam in the hilly area of the catchment. The latter includes villages that replaced the ones that were affected by the lake of the dam and the extension of the lake after the construction of the dam. A total of 30 KIIs were carried out across the three groups, and one FGD was conducted in each group of villages.
3.2 Spatial data and analysis
To map the topo-hydrological conditions and effects of flood in the study areas, we used different spatial datasets, as described in Table 1. All datasets were set/transformed to the same Coordinate Reference System (CRS), i.e. WGS84 UTM zone 36 for the Rahad River study area and WGS84 UTM zone 37 for the Khor Arbaat study area. The processing described below was done using a combination of software including QGIS ver. 3.28.14-Firenze, SNAP Desktop ver. 9.0.0, GRASS ver. 8.1 and in the Digital Earth Africa (DEA) Sandbox, a cloud-based computational platform that operates through a Jupyter Lab environment.
Table 1: Overview of datasets used and their main characteristics
|
Dataset name |
Description/purpose |
Source |
Resolution |
|
SRTM |
Coarse resolution DEM, overview on catchment scale of study region |
|
30m |
|
WOfS data |
Flood data for Rahad River based on Landsat time series for individual dates[2] (water and non-water classification generated per scene), annual (2022) and all-time summary (ratio of wet to clear observations per calendar year and since 1984) |
Digital Earth Africa (Muller et al., 2016) |
30 m |
|
S1 |
Radar data to extract 2022 flooded area in Rahad River |
ESA Sentinel 1 products from 20220816, 20220828 and 20220921[3] |
c. 10 m |
|
Cropland Extent Mask |
Crop mask |
Sentinel 2, Digital Earth Africa |
10 m |
|
OSM |
Background map and downloaded data on infrastructure (villages, roads) |
Open Street Map |
vector |
|
Infrastructure |
Complemented OSM data by own digitizing from GE imagery? |
|
vector |
|
CHIRPS |
Monthly and daily precipitation data since 1981 based on a combination of station data, satellite data and precipitation estimates from infrared Cold Cloud Duration (Funk et al, 2015) |
CHIRPS via DEA (Funk et al, 2015) |
5km |
SRTM data were processed in order to derive catchment and streamlines at a larger scale using topographical and hydrological tools from the Grass toolbox (e.g. r.slope.aspect, r.watershed, r.stream.basins).
The Water Observations from Space (WOfS) datasets summing sum up water and non-water pixels in all Landsat scenes from 1984 onwards and available products are all-time summaries, annual summaries or feature layers per scene (WOfL) (Mueller et al., 2016). WOfL products are binary datasets (water - non-water). WOfS summaries (all-time and annual) are ratios of wet to clear observations (formula 1). Pixels with water occurrence in 5% or less of the observations (not including 0) are considered flooded (Mueller et al, 2016).
Formula 1: WOfS Summary (frequency) = Number of Clear and Wet Observations/Number of Clear Observations.
To estimate flood effects on agricultural areas, we used the cropland mask for 2019 available from DEA (Table 1). Cropland is defined as "a piece of land of minimum 0.01 ha (a single 10m x 10m pixel) that is sowed/planted and harvestable at least once within the 12 months after the sowing/planting date." (DEA, 2024). The mask is derived from Sentinel 2 imagery using machine learning algorithms. For Eastern Africa the overall accuracy is 90.3% (op. cit.).
3.2.1 Rahad River
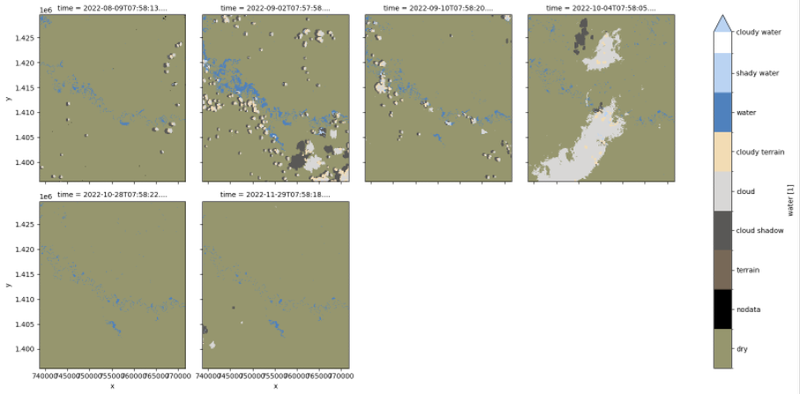
For Rahad River we used the best cloud free WOfL products from the period 1.08 – 30.11.2022, i.e. covering the flood event and the immediate time before and after (Figure 5 and A1). We also downloaded the all-time and 2022 annual summary products. They were reclassified based on the description in Mueller et al (2016) where pixels with water occurrence in 5% or less of the observations (not including 0) are considered flooded.
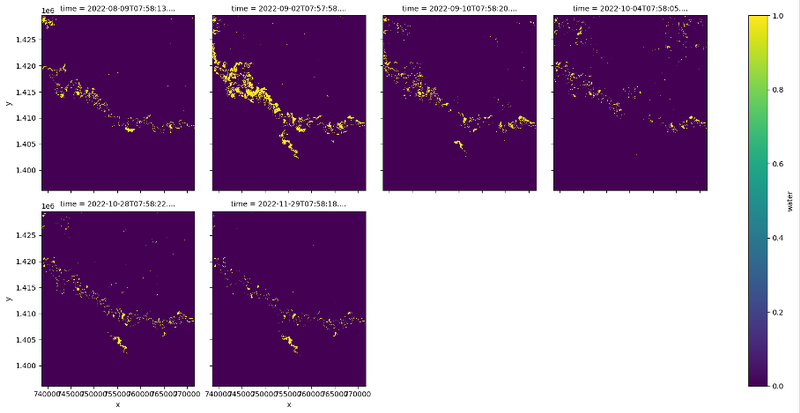
Figure 5: Overview of the selected WOfL data for Rahad study area. These were selected because of low cloud cover in the areas of interest.
For Rahad River, we also downloaded 3 Sentinel 1 images fulfilling location and time criteria (Table 1). Processing to extract a flood mask was done in SNAP according to recommendations from UN-SPIDER (2024), using the following steps and settings: subset to area of interest > Calibration (VV polarization, Output Sigma0 band) > Speckle filtering (7x7 Lee filter) > thresholding/BandMaths (water – non-water) > Range Doppler terrain correction (SRTM 1 sec bilinear; NN image resampling, 10m res). The threshold to distinguish between water and non-water pixels was set to 0.022 for all images based on visual inspection of the imagery. The resulting binary images (water - non-water) had a spatial resolution of c. 9 m.
The WoFLs and Sentinel 1 datasets from August and September 2022 were combined into one binary dataset to show which pixels had occurrence of water during the flood event.
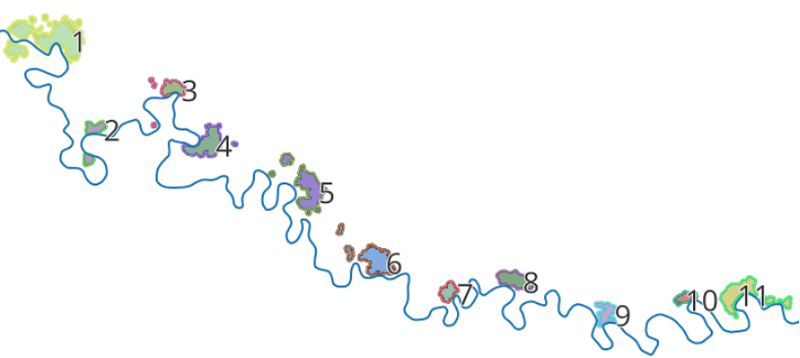
Infrastructure datasets were downloaded from OSM and complemented with our own digitizing to create a more up to date dataset of residential areas. Some residential areas were digitized at a large scale and in order to make village scale polygons they were simplified (1m tolerance), followed by calculation of concave hulls (6 points) that outlined the combined area. In addition to the basic village outline, another outline was made where a 100m buffer was added. These resulting village polygons (with and without buffer) were clustered together into 11 regions that were the basis for summary statistics (Figure 6).
Figure 6: Upper panel: A concave hull was calculated from multiple residential polygons in Rahad River (left) to outline the total village area (middle) and a 100 m buffer was added (right). The latter two types of polygons are the basis for village flood statistics. Lower panel: Village polygons were clustered into 11 regions with IDs from 1 to 11. The buffer zones are visible around each polygon in a contrasting color.

To analyze the effects of the flood events on agriculture, we created a 4km zone north of the river, which included the small-scale farming areas around the 11 villages of interest. Flood effects on residential and agricultural areas were summarized by overlaying them with the different flooding datasets (WOfS single scenes, sentinel 1, combined WoFS and Sentinel 1, and WOfS All-time Summary).
3.3.2 Khor Arbaat
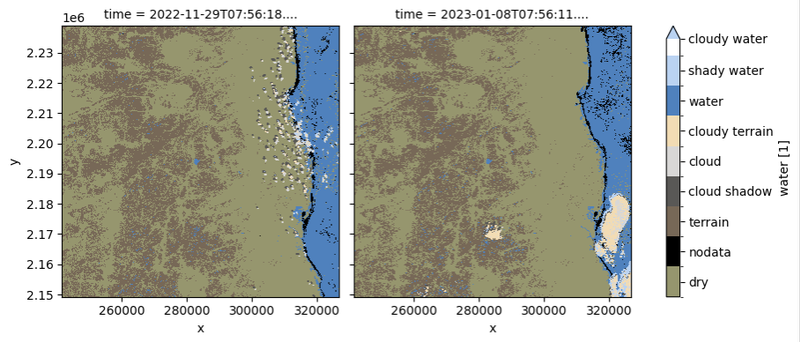
To map out the varying dam size and flooded areas in the dam surroundings we used WOfS Annual summaries from 2000 onwards. Flooded areas downstream of the dam were also mapped out. This part of the Arbaat catchment, referred to as the lower catchment, was extracted from the total catchment area using the SRTM stream network to identify the drainage divide downstream of the dam. Flooded areas were overlaid with the cropland mask (DEA) as explained above. The available WOfL scenes from the autumn 2022 flood event were also selected to look in more detail at the development and effects of that event. However, only two clear scenes were available for the period of interest (November 2022 - January 2023; Figure 7).
Figure 7: Overview of the selected WOfL data for Arbaat study area. These were selected because of low cloud cover in the areas of interest.
4. Findings
4.1 Rahad River area
4.1.1 Livelihoods activities
The villages in the Rahad River area ranged in size from 1200 to 8000 inhabitants with 170 to 1400 households. The basic services in the villages include elementary schools, health clinics, water yards and telephone network, and in the larger villages (such as Elebeig and Karesh Elfeel) there is a police station.
Crop farming and pastoralism are the main livelihood activities in the villages. Fishing from Rahad River is an important source of food and income for the inhabitants. The settled people are farmers who also raise livestock. Pastoralists are relatively new settlers and besides raising livestock, they practice limited rainfed crop farming. The crop farming system is mainly in the form of smallholdings and can be divided into rainfed crop cultivation and irrigated horticultural gardens. Rainfed crop cultivation is primarily stable crops for household consumption, such as sorghum, millet, groundnut, cowpeas, and okra. Additionally, cash crops – including hibiscus, tomato, cotton, and tasali (white-flesh melon cultivated for seeds) – may also be grown. The horticultural gardens located and irrigated along the Rahad River are for commercial purposes. In these gardens, fruits and vegetables – such as lemon, guava, mango, orange, grapefruit, onions, tomatoes, okra, chili, cucumber, eggplant, pumpkin, and cassava – are cultivated. Home gardening cultivating early maturing crop varieties such as corn, sweet sorghum and okra is another important farming practice in the Rahad River area and is considered an important food security element.
Settled pastoralists in the villages in the Rahad River area raise cattle, sheep, and goats. While the families are permanently settled and keep a few animals, male youth are mobile with the animal herds and flocks. Farmers raise sheep and goats, and sometimes cattle. When the number of heads owned by a farmer reaches the size of a herd, he sends the herd of animals away with a hired pastoralist during the rainy season.
Floods impact pastoralism and farming differently due to the nature of their activities. For pastoralists, the mobility of male youth allows them to move away from flood-prone areas, potentially reducing the risk to their livestock. However, the few animals left behind with settled families might face greater exposure to flood risks. On the other hand, farmers, especially those with large herds, send their livestock away with hired pastoralists during the rainy season, reducing direct flood impacts on their animals. However, floods could severely damage their crops and fixed assets. Thus, while pastoralists can leverage mobility to mitigate flood risks, farmers are more vulnerable to losing both livestock and crops.
4.1.2 Flood types and events
Heavy local rainstorms and the overflow of the Rahad river due to heavy rainfall upstream in Ethiopia cause the floods in the Rahad River area. Both types of flooding can take place during the peak of the rainy season during August. In some seasons, it is possible that some areas could be affected by both types of floods.
The torrent flood normally takes place in the rainfed farming fields. It normally does not reach the village boundaries. Informants agreed that the frequency of torrent flooding is increasing. Torrents occurring in the area are typically short-lived but can be extremely destructive, with the floodwater lasting up to a number of days or weeks. The level of the floodwater depends on rainfall intensity in different locations, the latitude and the discharge – in some areas, the level of floodwater may reach up to 80cm.
The Rahad River overflow floods happen during the peak of the rainy season in August. The most affected areas are the lowlands along the river banks where the villages are located. While this type of flood happens relatively infrequently, it causes significant destruction, and floodwater can reach up to three meters. The most destructive Rahad River overflow flood happened in August 2022 when ten villages were completely flooded and 42 villages were partially affected. Other significant river overflows remembered by informants in the last twenty years were in 2004 and 2011 (see also Appendix 1).
4.1.3 Impacts and consequences of floods
Torrent floods can lead to a significant reduction in crop yield and quality as the heavy rain sweeps away the rainfed cultivated crops. In some villages, entire fields may be rendered unsuitable for cultivation for extended periods, leading to food shortages and economic losses for the farming community.
Moreover, the recovery process can be lengthy and costly, as it may involve soil rehabilitation, rebuilding of infrastructure, and re-cultivation of crops. The disruption of market activities due to damaged transportation routes can also affect the sale and distribution of agricultural products, further impacting the livelihoods of farmers and the food supply chain.
Road networks, which are unpaved, are often swept away and the villages become isolated and inaccessible. This disconnects neighboring villages from each other and also from the road to Gadarif, the capital of the state. The aftermath of these floods may extend until the beginning of the dry season in November. For example, in 2011 the villages in the flood prone area along the Rahad River were not reachable from mid-August until late November. In some villages, such as Karesh Elfeel, infrastructures such as schools and health centres were damaged by the floods.
During 2022, the Rahad River flooded and people living in the affected villages were moved to higher altitude areas where they stayed for two to four weeks until the floodwater receded. In the village of Afrush Tobac, the situation was worse because the whole village was isolated from its surroundings by floodwater and the only way to evacuate the people was through boats to Bandegeo which was not affected by the flood.
This flood caused extensive damage. A large number of families were affected as hundreds of homes collapsed, crops in the home gardens were destroyed, and rainfed agricultural fields in the vicinity of the villages were flooded. Crop husbandry practices, such as weeding, were delayed or missed as people had to rescue themselves, their animals, and their properties from the floods. This led to a big reduction in crop yield and harvest. Horticultural gardens were also affected as vegetables were lost, tree productivity was reduced, and infrastructures – such as wells and mechanical water pumps – were damaged by the floods.
The floods affected the whole food production cycle, including the farmers’ preparations for the next growing season. Farmers in the Rahad River area store their harvest inside their household compounds in huts and sell small quantities according to their needs. They continue to do so until the approach of the next cultivation season, at which time they sell the remainder of the stored harvest, holding back enough to cover their food needs up to the new harvest. They use the money earned from sales of the remaining harvest to buy agricultural inputs and to rent machinery, which is used to prepare and plough the soil at the outset of the new rainy season. This whole production cycle was disturbed because of the floods.
The impact of floods on pastoralists and their livestock in the Rahad River were also profound. The Rahad River overflow floods in 2022 had significant impacts on livestock, which are crucial to the livelihoods of many people in the area. Informants mentioned that many animals were lost due to the swift currents and high water levels, leading to a direct economic loss for pastoralists and farmers. The flood was also associated with disease outbreaks (e.g. foot rot). Moreover, as pastures become submerged, the availability of natural vegetation decreases, leading to a feed crisis. This can result in malnutrition and reduced productivity of the surviving livestock.
4.1.4 Mitigation and coping measures undertaken in the affected villages
There is no early warning information system in Rahad River area. Informants mentioned that there was an absence of information from official sources such as television channels and radio stations. Local residents learned about the flood via telephone calls from their local networks or from across the border in Ethiopia.
The news about the high water levels reached them just 6 to 15 hours after the initial occurrence of the flood upstream, which is a short time to prepare to evacuate from the area. In some villages, these warnings were considered rumors, so people did not respond. In Afrush Tobak village, however, the villagers worked together and built earth terraces surrounding the village (Figure 8). In Elebeig, the community constructed earth terrace in the low points along the river bank, but these efforts were not sufficient to protect them from the flood.
In some villages, there is discussion about relocating the village from the lowland along the river to a higher altitude site. This is a hot issue in Karesh Elfil and there is acute polarization between the group advocating for relocating away from the river and the group wanting to remain. At the household level, some families decided to leave the flood prone areas and migrate to safer villages such as Bandegeo or even to urban centres such as Gadarif. The same also applies for agricultural land and some farmers are abandoning the flood-affected agricultural fields and hiring or borrowing alternative land in locations not prone to floods.
In case of light floodwater lasting for shorter periods, farmers built terraces around their fields and re-cultivated crops that can withstand partial water logging, such as some sorghum varieties. When there is a long-lasting torrent, farmers usually wait until the submerged fields dry up and then they cultivate cowpeas, watermelon, and tasali.
Farmers that lost their harvest due to floods are forced to work as wage laborers in the large-scale mechanized farms in the region that are normally located in areas less affected by the floods. While men can get long contracts, women work mainly as daily laborers, returning to their homes at the end of the day to take care of their domestic work. A female informant from Aradebat Eltijani said: “The 2022 flood forced me to work as a wage laborer in a large-scale mechanized farm in the vicinity of the village. It is the first time that I have worked as hire laborer. I normally work on our own farm, and we use to have enough harvest from our home garden and the rainfed farm. In this season, we harvested nothing. My husband migrated and stayed away from us and he got a contract as wage laborer for months in the large-scale farms”. Male youth also migrated to work in the artesian gold mining sites in the region.
Flood events also disrupted the annual cycle of movement for pastoralists who were forced to migrate away from the unhospitable conditions created by the floods in search of higher ground and new grazing areas Pastoralists sent the animal herds away from the area during the floods, meaning that they had to employ an additional herding laborer to look after the animals and prevent them from trespassing into agricultural fields.
Informants acknowledged that the main challenges facing them are the lack of early warnings, meaning they cannot properly cope with or prepare for the floods. Additionally, there is no effort to establish such a system in the area. Insufficient infrastructure and resources, such as a lack of transportation, hinder a timely response and the recovery efforts. Vulnerable people (such as low-income families, female-headed families, and the elderly) are most affected by the floods.
Figure 8: Earth terrace in Afrush Tobak village built in 2022 to protect the village from the flood.
4.1.5 Spatial data analysis
According to the cloud-free WOfL data the flood started early in August 2022 (Figure 9). It is not possible to identify which date the flood peaked from the data, however, the flooded area is at its most extensive in the WOfL data from 2nd September 2022. By 10th September, there is already a significant retreat of water in the lower parts of the study area. In the upper part of the study area, however, there are still larger water patches visible in late October and water seems to withdraw slower here than in many other areas. There are also scattered areas in the whole study area where water still remains in late November.
Figure 9: WOfL timesteps with nearly cloud free conditions for Rahad River. Yellow indicates water covered pixels and purple dry pixels.
Looking in more detail at the WOfL data, we can see that the effects of flooding on residential areas were primarily in the buffer zone at the earliest dates (Figure 10). By 2nd September, large water bodies formed on the floodplain as separate or interconnected pools, the majority of which are large in size and in the area south of ID3 and north of ID6 there is one large water body connected to the main river at several places. Close to ID8 and Karsh Elfil (ID11) there are separate water bodies north of the main river. Although several villages are affected at this early stage, it is remarkable that they are placed in areas relatively less affected by the flood. On 10th September, the flooded areas were significantly smaller in general and were also concentrated in the village areas, except in Karsh Elfil where water covered larger areas because a more central (western) part also was flooded. One of the pools close to the village also expanded.
The S1 data for 16th August 2022 records water in many of the same areas as the WOfL data from 8th August, however there is much less water, whether the water retreated between these dates is unknown to the authors. S1 data records an increasing water level from 16th to 28th August. The water level on 28th August was significantly lower than on the WOfL data from 2nd September. The same is true comparing the last S1 dataset (21.9) with WOfL data from 10th October, although the areas affected are primarily the same.
Figure 10: Results from WOfL from 9.8 (upper), 2.9 (middle) and 10.9 (lower). Cyan color are pixels defined as flooded (cf. Table 2), dark purple are residential areas/villages (with 100m buffer) and magenta colors are flooded areas within villages
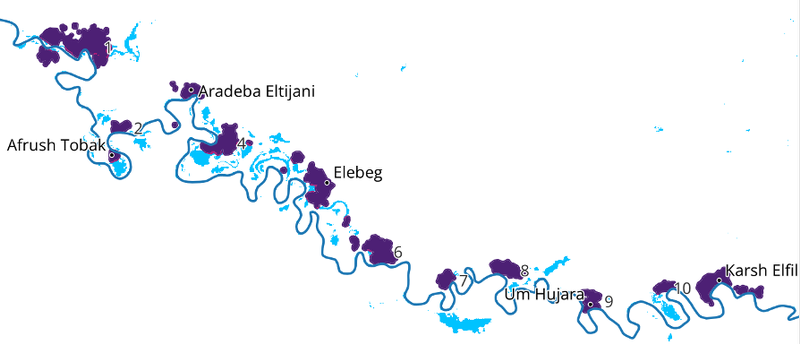
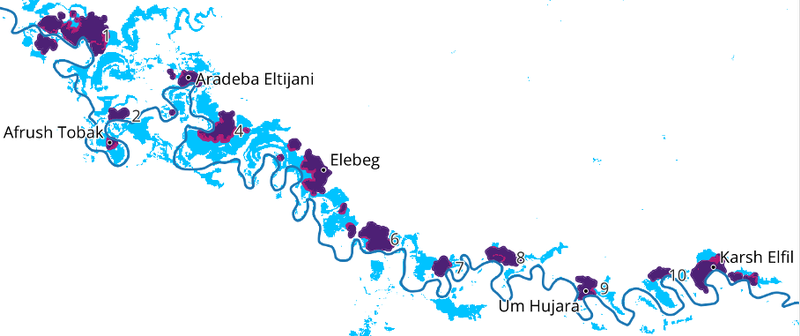
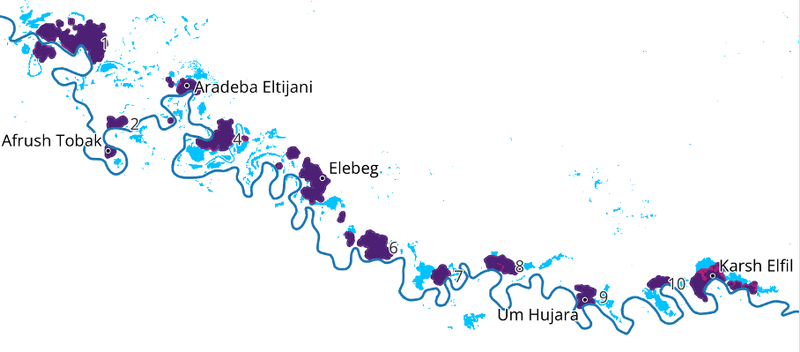
Figure 11: Results from Sentinel 1 data from 16.8 (upper), 28.08 and 21.9.2022 (lower). Cyan color are water covered pixels, dark purple are residential areas/villages (with 100m buffer) and magenta colors are flooded areas within villages
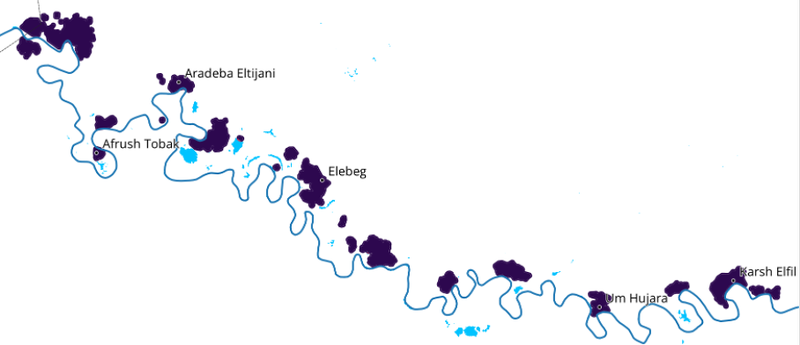
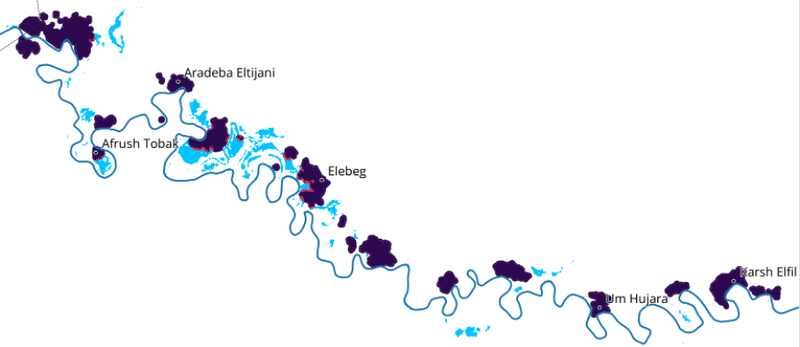
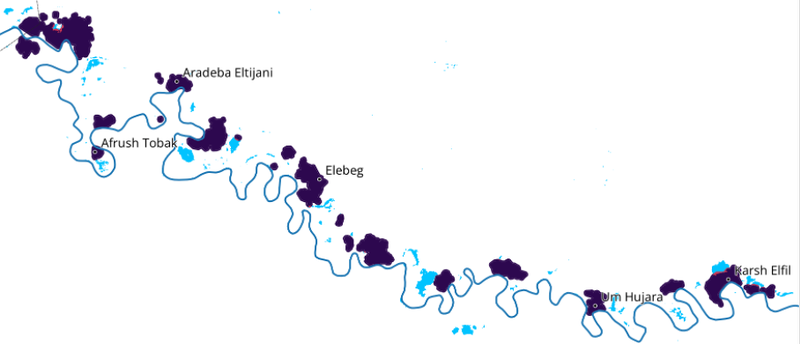
Combining all the datasets (individual, WOfL, and S1) gives an impression of the total flood effect for the whole period it lasted. The above findings are corroborated and in summary we can see that large areas have been affected and that the majority of villages are mainly affected in their peripheries (Figure 12).
Figure 12: Results from Sentinel 1 and WOfS data combined, for villages (dark purple) with 100m buffer zone (upper) and without buffer zone (lower). Cyan to blue colors are water covered pixels (darker blue with increasing number of times a pixel has been mapped as flooded), magenta to orange colors are flooded areas within villages (more orange with increasing number of times a pixel has been mapped as flooded).
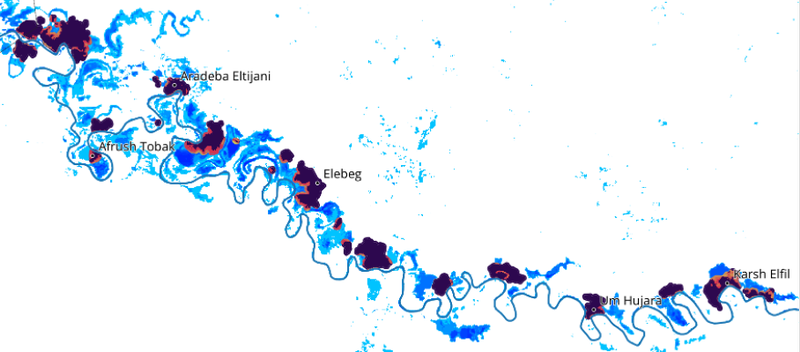
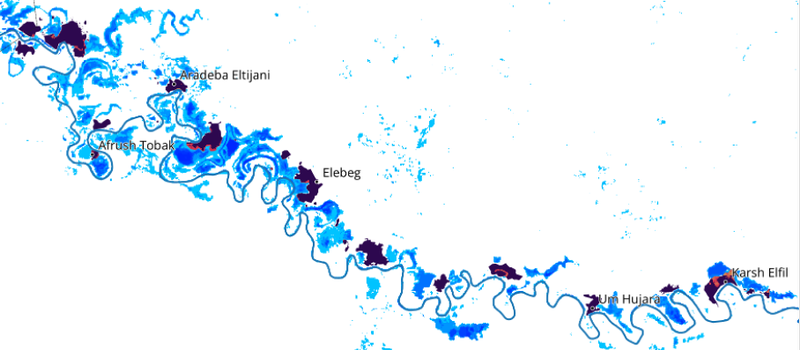
The overlay analysis (Table 2) found that between 0 (ID7,9,19) and 25% (ID11: Khars Elfil) of the strictly defined village areas (without buffer zone) were affected by the flood. When including the 100m buffer zone, the figures increased to between 8 (ID7) and 41% (ID4). Compared to the WOfS all-time summary, it is apparent that this event was one of the larger flood events in terms of affecting villages. For the strict village definition, 18.4% of the ID4 area was affected in the 2022 event, compared to 22.3% when looking at all flood events combined. For ID11, Karsh Elfil, the numbers are 24.9% compared to 31.1%. For the buffered village definition, more villages are severely affected compared to all flood events combined, some with nearly the same numbers for 2022 and the all-time summary (Table 2).
Table 2: Summary of flooded areas in hectares (ha) and percentage for the villages (ID; see Figure 6) for 2022 compared to All years. 2022 flood extent is a binary calculation based on WOfL data (cloudfree data from August and September) and Sentinel 1 scenes. All years flood extent is derived from the corresponding WOfS summary dataset, using pixels with less than or equal to 5% occurrence of pixels with water observations as an indication of flooding.
|
ID |
|
2022 |
All years |
|
2022 |
All years |
||||
|
total area (ha) |
flooded (ha) |
flooded (%) |
flooded (ha) |
flooded (%) |
total area buffered (ha) |
flooded (ha) |
flooded (%) |
flooded (ha) |
flooded (%) |
|
|
1 |
192,2 |
9,5 |
4,9 |
35,9 |
18,7 |
373,6 |
66,7 |
17,9 |
111,0 |
29,7 |
|
2 |
28,4 |
2,6 |
9,2 |
9,2 |
32,3 |
68,9 |
18,6 |
27,1 |
27,5 |
40,0 |
|
3 |
32,4 |
1,6 |
5,0 |
6,8 |
20,8 |
79,8 |
14,7 |
18,4 |
22,8 |
28,5 |
|
4 |
81,1 |
14,9 |
18,4 |
18,1 |
22,3 |
143,6 |
58,5 |
40,7 |
59,7 |
41,5 |
|
5 |
98,2 |
3,5 |
3,6 |
12,9 |
13,1 |
193,4 |
40,3 |
20,8 |
57,9 |
29,9 |
|
6 |
86,1 |
0,2 |
0,2 |
1,0 |
1,1 |
169,7 |
20,6 |
12,1 |
20,4 |
12,0 |
|
7 |
24,5 |
0,0 |
0,0 |
0,1 |
0,4 |
52,3 |
4,1 |
7,7 |
4,3 |
8,3 |
|
8 |
52,8 |
4,7 |
8,9 |
7,5 |
14,1 |
91,9 |
8,6 |
9,4 |
19,5 |
21,3 |
|
9 |
30,2 |
0,0 |
0,0 |
0,0 |
0,0 |
70,7 |
8,6 |
12,2 |
6,7 |
9,4 |
|
10 |
14,0 |
0,0 |
0,0 |
0,5 |
3,8 |
42,4 |
4,3 |
10,2 |
8,5 |
20,0 |
|
11 |
82,5 |
20,5 |
24,9 |
25,7 |
31,1 |
174,1 |
58,6 |
33,7 |
63,5 |
36,5 |
The flood effect on croplands are summarized in Figure 13 and Table 3. Within the 4km buffer zone, the cropland mask mapped around 105000 ha as croplands. Of these, 0.8 % were affected by the 2022 flood, compared to 1.1% affected by all flood events since 1984. Although the numbers are comparable, it is clearly visible in Figure 13 that there are several areas affected by the 2022 flood that have not been affected by previous floods. These areas are primarily located in the downstream part of the study area, but also around Aradeba Eltijani (ID3) and Elebeg (to the north and west) and to a lesser extent higher up in the study area. Previous flood events seem to have affected more croplands further away from the river and in smaller patches.
Figure 13: Flood effects on cropland within a 4km buffer north of the river. The light grey areas are croplands not affected, light green areas were affected by earlier flood events (since 1984), orange areas by the 2022 flood and yellow areas by both earlier and the 2022 flood event.
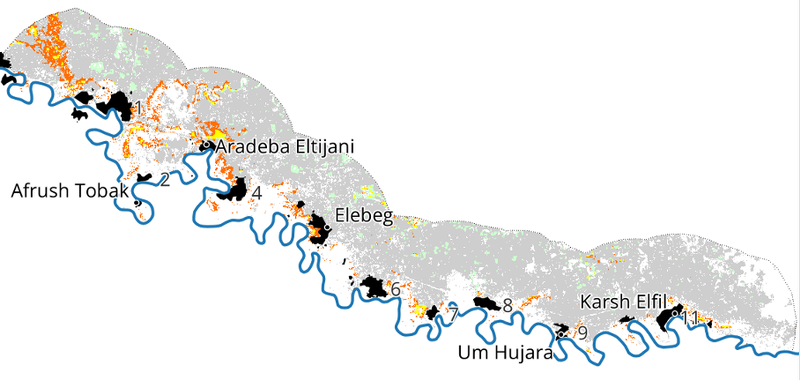
Table 3: Summary of flooded areas in hectares (ha) and percentage for cropped areas in Rahad for 2022 compared to all-years. The 2022 flood extent is a boolean combination of WOfL data and Sentinel 1 scenes. All-year flood extent is from the corresponding WOfS dataset, with the different categories indicating the frequency of water occurrence in each pixel. The class with 1-5% water occurrence is an indication of flooding.
|
2022 |
797 |
0,8 |
|
Crop area |
area (ha) |
% |
|
all year <1% |
6424 |
6,1 |
|
all year 1 -5% |
1144 |
1,1 |
|
all year 5-20 % |
316 |
0,3 |
|
all year >20% |
97 |
0,1 |
|
total area |
104882 |
4.2 Arbaat area
4.2.1 Livelihoods activities
In Arbaat area, most of the population are settled and transhumant pastoralists and agro-pastoralists. The transhumant follow seasonal movement patterns between the Gunub (coastal plain) and the Awlib (plateau west of the mountains) according to the rainy seasons. The pastoralists own goats, sheep, and camels. For the residents of the Arbaat valley and delta, seasonal rain-fed agriculture, flood-fed grains and vegetables, and irrigated horticulture remain the main income activities. Those living in the villages on the coast work in sea fishing. Farming is practiced by settled inhabitants such as the villages of Eshanak, where the population depends on the cultivation of vegetables, and some have horticulture farms where they grow lemons, guava and palm trees. In the villages neighboring the lake of the dam, people cultivate vegetables when the dam lake is confined, while others work in wood-cutting and charcoal making. Some local residents, especially those who were displaced when the dam created a lake, practice artisanal gold mining.
In villages close to the lake, e.g. Adel Amay village, people move seasonally to the hills to protect their children and animals from drowning because the lake of the dam covers their settlement area (their land). Because of the lake, mosquitos saturate the area and diseases spread. Some people from Adel Amay also attempt to grow fruit in the area that is uncovered by the receding waters, though the arrival of another flood would cover what they manage to grow.
4.2.2 Flood types and events
The Arbaat area is flooded approximately twice a year: once in the winter season when the rain hits the sub-valley coastal areas; second in the autumn when rains fall in the upper part of the catchment in the area west of the Sinkat. From there Khor Arbaat flows in an area of more than 150 km through the plateau of Odrus. Informants explained that the durations of the flood vary from one day in the area below the dam to one week in the area above the dam.
4.2.3 Impacts and consequences of floods
The study area covers three different zones affected by the Arbaat dam: the lower delta and upper delta downstream of the dam, and the area upstream of the dam.
In the villages of the lower delta, all horticultural farms dried up after the establishment of the dam because the valley water was restricted. Agriculture in the area now depends on rainfall, typically during winter in the coastal area. Moreover, some villages such as Arbibyay have also been affected by the establishment of the continental coast road that connects Port Sudan to Egypt and passes through the Delta of Khor Arbaat (16km from Port Sudan). There are no bridges or openings under the road to let water flow naturally which restricts the flow of water and leads to the drying of farms in the delta along the coast. Residents on the opposite side of the road have been severely affected by the flood with impacts such as flooding of crops, drowning of livestock, and the collapse of houses.
In the upper delta villages, located in the area just below the Arbaat Dam construction, the inhabitants rely for their livelihood on flood agriculture. There are also a few horticultural farms in the area, irrigated by well water and local seasonal rains, they also benefit from the water in the dam and can be affected by the overflow flood from the lake. The creation of the lake also caused a loss of agricultural land: in some villages close to the lake, residents lost 90% of their agricultural land when the lake was created. In response, some of them turned to work in agriculture in the area just upstream where crops can be grown after the water in the dam recedes. However, agriculture in this area is high risk as it will be flooded by the expansion of the water of the dam lake in the event of rain in the upper Arbaat area.
In the area upstream of the dam, the villages are affected by Khor Arbaat floods. Cattle and crops have been swept away and fruit and palm trees have been uprooted. The area also suffers from soil erosion on both sides of the stream at the expense of cultivated areas that shrink every year. The water in the dam is also a source for the spread of the mesquite tree (Prosopis sp.) and the breeding of mosquitoes which leads to the infection of humans and animals with diseases such as malaria. Furthermore, the informants reported that the lake emits a pungent smell and pests from the lake can infect crops – especially fruits and dates – meaning they are unfit for consumption.
According to our informants, the torrents in the upper areas of Arbaat have caused loss of livestock through drowning of animals, soil erosion, and crop destruction. In turn, this has led to the abandonment of agriculture and the demolition of homes and infrastructure, such as roads. The dam has also closed the only water outlet and the previous route to downstream Khor Arbaat, which was the shortest route to Port Sudan. The route to Port Sudan is now through the hard mountainous area where trucks and lorries are the only possible means of transportation, instead of small cars that could be used in the past. This means that several farmers have become unable to transport their products to markets in the city of Port Sudan. The floods are also destroying the fences of farms, backfilling of wells and pipe damage, among other effects.
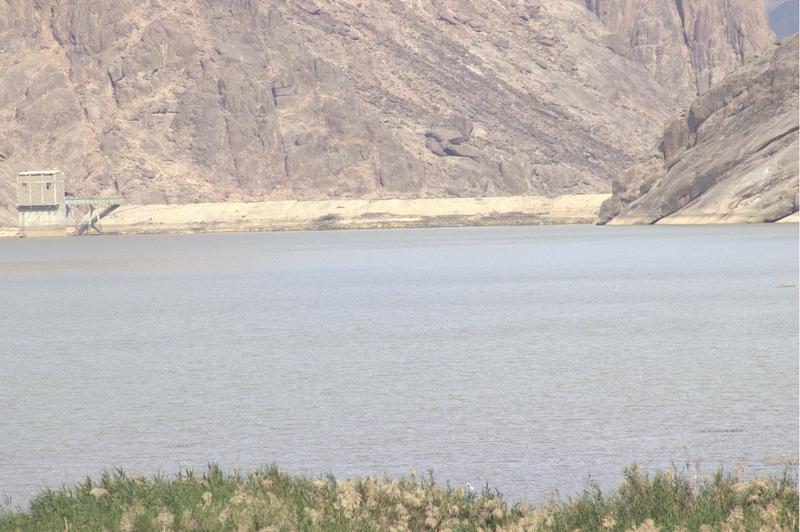
Figure 14: The lake of Arbaat dam in January 2024. The figure shows an overview of the lake of Arbaat Dam.
4.2.4 Mitigation and coping measures undertaken in the affected villages
The valley runs in a rugged mountainous and agriculture is carried out on both sides of the watercourse in the estuaries of the side valleys. This means that there are no options for measures to prevent and respond to the effects of torrential rains and floods in the area above the dam.
There is no early warning information system in the area except for the traditional methods used to monitor lightning and clouds, which reduces the element of surprise but does not predict the magnitude of the floods. Therefore, instances of sudden torrents are frequent when there is heavy rain in remote areas within the catchment of the valley. These sudden torrents frequently result in the drowning of livestock.
Farmers manually construct small earth terraces to protect their farms. In some places, large earth terraces to protect farms and reduce soil erosion have been built using heavy machines. Almost all the population of the villages closest to the dam have moved from areas threatened by flood to higher and safer locations in the nearby mountains to avoid the floods. These people return seasonally to cultivate crops and benefit from flood irrigation, many have tended to dig wells and switched to a type of irrigated agriculture.
4.2.5 Spatial data analysis
The dam was constructed in 2000, but according to the WOfS annual summary data, it did not fill properly for the first years thereafter. In the period from 2004 - 2007 another smaller body is visible downstream of the main dam location. This might be related to the overflowing of the dam. According to the satellite data, the water-covered area of the dam has varied from year to year, with the minimum area (after first being filled) in 2008, and other low levels in 2012 and 2016. The general trend since a local max in 2013 is decreasing the water-covered area. The highest area of water recorded was in 2007, covering an area of just above 3km2 (Figure 15 and 16 Upper Panel).
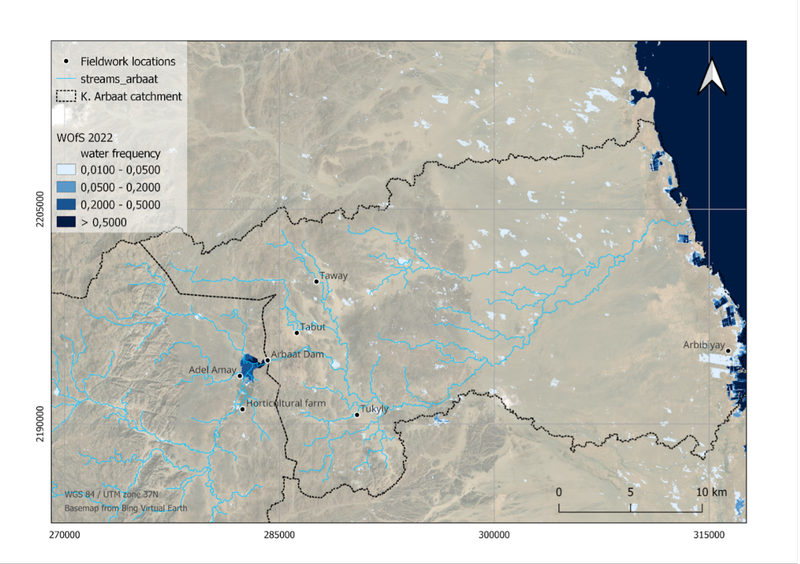
The flooded area (1-5% water frequency in WOfS annual summaries) in around the dam has also varied from year to year (Figure 16 Lower panel). The data, with its limitations, suggest that there has been nearly no flooding until 2013. Thereafter, between c. 0.2 and 0.4 km2 have been flooded annually. In 2022 around 1.4 km2 was recorded as flooded, which is exceptional compared to previous records. Looking in more detail at this data shows that larger water bodies have formed in various locations in the landscape (Figure 17). Whether these are results of the November 2022 event is uncertain as the WOfL from 29th November does not show these smaller water bodies (Figure A3). CHIRPS data suggest that the main rainfall in the month was between 10th and 12th November (Figure A3).
Figure 15: Water levels in Arbaat Dam and surroundings in the period between 2000 and 2022 from WOfS Annual summary data. Pixel values show the frequency of wet pixels in relation to clear, dry pixel observations.
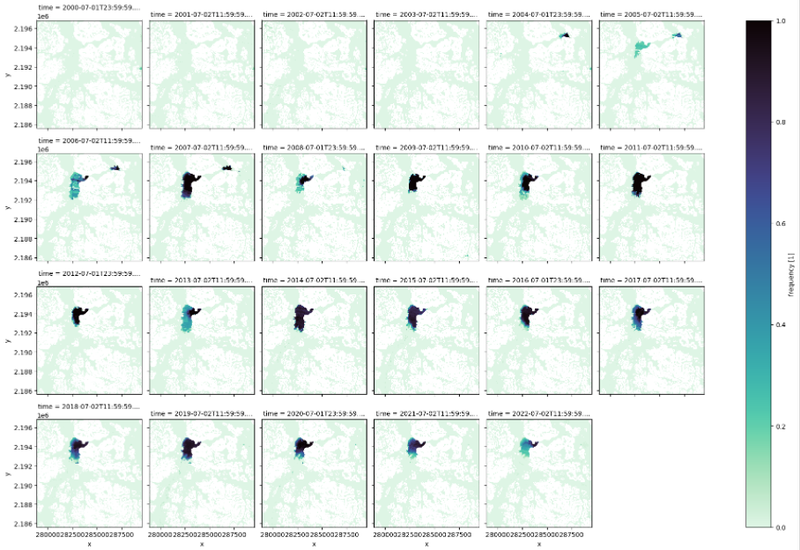
Figure 16: Annual area of water in Arbaat Dam and surroundings. Upper panel: All pixels with a frequency above 0.2 were summed up to calculate the water covered area. Note that the area of interest is the same as in the figure above and that the smaller basin downstream of the dam is included in the estimated area. Lower panel: All pixels with a frequency between 0.01 and 0.05, i.e. flooded areas, were summed up to calculate the water covered area. Note that the area of interest is the same as in Figure 15.


Figure 17: The water frequencies in 2022. Light blue (0,01 - 0,05) indicates flooded areas. Several large water bodies have formed in the area surrounding and downstream of the Arbaat dam. The dotted line right below Arbaat Dam indicates the divide between the upper and lower Arbaat catchment.
The flooded areas in lower Arbaat catchment show the same temporal development as described above. The total covered areas of flood water according to the WOfS annual summaries for the lower catchment is in the range of 2-4km2 for most of the years since 2013, except for the exceptional levels in 2022 (Figure 18).
Figure 18: Annual area of flood water in lower Arbaat catchment between 2000 and 2022. All pixels with a frequency between 0.01 and 0.05 were summed up to calculate the water covered area.

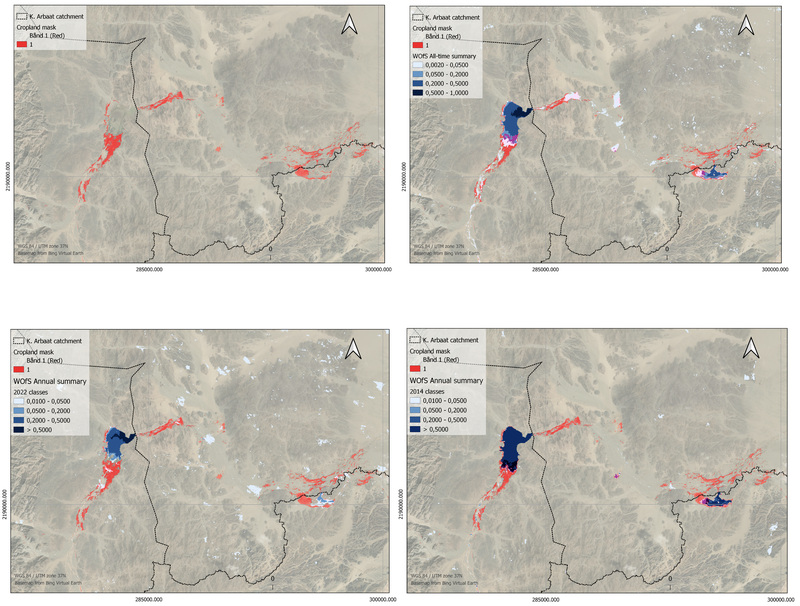
The impact of floods on croplands in the area is most notable around the lake itself and directly downstream of the dam (Figure 19). However, some of the areas identified as cropland in the cropland mask are not cropland. This is particularly obvious around the lake where large areas are overgrown by mesquite (Prosopis sp.) but identified as cropland. Also, the cropland mask does not identify small scale areas where water is harvested for agricultural purposes as croplands.
Figure 19: Flood impact on cropland around the Arbaat dam. Upper left: cropland mask; Upper right: WOfS All-time summary; Lower left: WOfS 2014; Lower Right: WOfS 2022. All overlays between cropland mask (red) and WOfS layers (blue tones) display areas with both crops and flood water in tones of light pink to purple/nearly black.
5 Conclusions
The report provided a comprehensive analysis of the challenges and complexities faced by communities in flood prone areas, namely in the Rahad River area and Khor Arbaat basin in eastern Sudan. The findings emphasize the multifaceted impacts of flooding, the coping strategies employed by local communities, and the need for improved flood risk management.
The report highlights the severe impact of flooding on agriculture and livelihoods in the study areas. In the Rahad River area, floods disrupt the agricultural cycle, leading to significant reductions in crop yield and quality. The destruction of infrastructure, such as roads and buildings, exacerbates the isolation of communities and hampers recovery efforts. Similarly, in the Khor Arbaat basin, the construction of the dam has altered hydrological conditions, affected agricultural practices and led to displacement.
The communities in both areas have developed coping strategies to mitigate the impacts of floods. These include building earth terraces, relocating to higher ground, and diversifying income sources through wage labor or artisanal mining. However, the lack of early warning systems and inadequate resources limit the effectiveness of these strategies, highlighting the need for external support and capacity building.
The use of spatial data in the report provides valuable insights into the extent and frequency of flooding. The analysis reveals that significant portions of residential and agricultural areas are affected during flood events, emphasizing the need for targeted interventions in these zones. The data also indicate changes in flooding patterns over time, which could inform future flood risk management strategies.
In flood management efforts in Sudan, it is essential to shift from a top-down approach, which often benefits powerful actors while placing disproportionate burdens on vulnerable rural communities. The collapse of infrastructure, like the Arbaat Dam, illustrates how such projects can disrupt local livelihoods by increasing flood risks for some while benefiting others. To address these inequities, future flood management must integrate local knowledge and community participation to create more sustainable and inclusive solutions.
Accountability and transparency should be core elements of flood management, ensuring that powerful actors are responsible for the negative impacts of their decisions. Additionally, adopting a holistic approach that considers both technical solutions and the socio-political dynamics shaping flood risks will lead to more equitable outcomes. Policy recommendations should emphasize community engagement, equitable infrastructure development, and frameworks for local populations to play a significant role in managing flood risks. This approach promotes both social justice and environmental sustainability in future flood management strategies.
The findings of this report underscore the importance of integrating local knowledge and spatial data in flood risk management. Developing early warning systems, improving infrastructure resilience, and supporting sustainable land management practices are crucial steps in reducing vulnerability. Additionally, fostering community engagement and collaboration with local and international stakeholders can enhance the adaptive capacity of these communities.
While the report provides a detailed analysis of flood impacts and coping mechanisms, further research is needed to explore the long-term socio-economic effects of flooding on affected communities. Additionally, the limitations of spatial data in accurately capturing small-scale agricultural practices highlight the need for improved data collection methods.
In conclusion, the report offers a critical examination of flood risk in Eastern Sudan and provides a foundation for developing more effective and sustainable flood management strategies. By addressing the challenges identified and leveraging the opportunities for improvement, stakeholders can enhance the resilience of communities to future flood events.
Here are some further conclusions on specific topics handled in the report:
Vulnerability and impact: The Rahad River area is highly vulnerable to flooding due to its geographical location in lowlands along the river banks. In the Arbaat area, the destruction is mostly due to the construction of a new dam without taking into consideration the interests of the local community. The floods caused extensive damage to homes, infrastructure, and agricultural land, leading to significant economic losses for the affected communities.
Coping and adaptation: The lack of an effective early warning system exacerbates the community's vulnerability. Informants indicated that flood warnings often arrive too late for adequate preparations. As a coping mechanism, some communities have considered relocating to higher altitudes, while others have built earth terraces around villages and fields. Despite these efforts, many families were forced to migrate or seek alternative livelihoods.
Livelihood disruption: Floods have disrupted the livelihoods of both farmers and pastoralists. Farmers lost their harvests and were compelled to work as wage laborers on mechanized farms. Pastoralists had to alter their livestock mobility patterns, searching for higher ground and new grazing areas. This disruption has led to economic instability and increased labor demands.
Recovery and future strategies: Recovery from floods is a lengthy and costly process, requiring soil rehabilitation, infrastructure rebuilding, and crop re-cultivation. The report emphasizes the need for improved flood management strategies, such as developing reliable early warning systems and enhancing community preparedness to mitigate future flood impacts.
6. Recommendations
The recommendations for decision-makers in the report focus on improving flood management and mitigation strategies. The key recommendations are:
- Early warning systems: Implementing early warning systems is crucial for riverine floods, which are more predictable. For flash floods, improved monitoring and community preparedness are necessary. This can help communities prepare and respond more effectively to minimize impacts.
- Infrastructure improvements: There is a need for improved infrastructure to prevent and mitigate flood damage. This includes enhancing road networks and building better drainage systems to reduce the impact of floods. Invest in infrastructure projects that enhance flood defenses, such as constructing levees and floodwalls, improving drainage systems, and reinforcing existing structures to withstand flooding.
- Community preparedness and coping mechanisms: Strengthening local communities' capacities to cope with floods through education and resources can significantly reduce the negative impacts. This involves developing community-based response plans and improving local infrastructure
- Relocation and land use planning: Consider relocating vulnerable communities and reassessing land use planning to reduce exposure to flood prone areas. This may involve relocating villages or agricultural lands to higher ground. However, it is essential to adopting a participatory approach to relocate vulnerable communities and reassess land use in flood-prone areas, which requires inclusive and community-driven engagement.
- Integrated water resource management: Implement integrated water resource management approaches to balance the needs of different water users and reduce the risk of floods caused by upstream activities.
- Monitoring and data collection: Enhance monitoring and data collection efforts to better understand flood patterns and impacts. This can support more accurate risk assessments and inform decision-making.
- Support for agriculture and pastoralism: Given the severe impact on agriculture, there is a need for disaster preparedness and support mechanisms. This includes helping farmers with soil rehabilitation, providing agricultural inputs, and offering financial support to recover from crop and livestock losses.
- Health and sanitation: Floods increase health risks, such as the spread of infectious diseases. Decision-makers should prioritize improving health and sanitation infrastructure to prevent outbreaks during and after floods.
- Holistic recovery approach: The recovery needs to go beyond immediate flood impacts, considering the broader context of economic hardship and ongoing conflict. A holistic approach to recovery planning should include the consequences of the ongoing conflict and support for displaced populations.
- Spatial and topographic analysis: Decision-makers should utilize spatial and topographic analyses to better understand flood-prone areas and tailor mitigation strategies accordingly. This includes mapping out flood risks and assessing the vulnerability of specific regions.
These recommendations aim to address both the immediate and long-term challenges posed by flooding in Sudan, considering the country's current socio-political context. These recommendations also aim to enhance the capacity of decision-makers to effectively manage flood risks and improve the resilience of affected communities.
The fieldwork for this study was conducted in late 2023 and early 2024, before the collapse of the Arbaat Dam in August 2024. Here are some recommendations for its future reconstruction emphasizing several key points:
- Community engagement: Involve local communities, particularly farmers and pastoralists, in the planning and decision-making process to ensure their needs are met and avoid repeating top-down approaches that disregard local realities.
- Improved flood management: Implement robust early warning systems for floods, which could help mitigate future damage by providing communities with time to respond to flood risks.
- Strengthened infrastructure: The dam’s design should be reassessed to handle extreme weather events, with regular maintenance routines to prevent issues such as sediment buildup that contributed to the collapse.
- Environmental and social considerations: Address the environmental impacts and restore ecosystems, while also compensating local communities for lost livelihoods. Support initiatives that diversify income sources and reduce reliance on vulnerable areas.
- Integrated water resource management: Ensure balanced water distribution that addresses the needs of agriculture, pastoralism, and domestic use, with proper drainage systems to prevent waterlogging.
References
Ali, H. O. 2022. Hydro-environmental impact of Khor Arbaat Dam, Eastern Sudan. International Journal of Water Resources and Environmental Engineering. Vol. 14(1), pp. 1-11. DOI: 10.5897/IJWREE2022.1027.
Babiker, A., Pal, I. 2022. Community Perception of Flood Induced Health Risk in Sudan, A Case Study of Sharq El-Nile Area. DOI: 10.1007/978-981-19-4715-5_14. In book: Proceedings of the 2nd International Symposium on Disaster Resilience and Sustainable Development, Volume 1 - Multi-hazard Vulnerability, Climate Change and Resilience Building
DEA, 2024, Cropland extent maps for Africa, https://docs.digitalearthafrica.org/en/latest/data_specs/Cropland_extent_specs.html, visited 11.07.2024
Elagib, N. A., Al Zayed, I. S., Saad, S. A. G., Mahmood., M. I., Basheer, M., Fink, A. H. 2021. Debilitating floods in the Sahel are becoming frequent. Journal of Hydrology, 599 (2021) 126362. DOI: 10.1016/j.jhydrol.2021.12636
Funk, C., Peterson, P., Landsfeld, M. et al. The climate hazards infrared precipitation with stations—a new environmental record for monitoring extremes. Sci Data 2, 150066 (2015). https://doi.org/10.1038/sdata.2015.66
GFDRR (Global Facility for Disaster Reduction and Recovery). 2021. Sudan Rapid Post Disaster Needs and Recovery Assessment (Rapid PDNRA). Link: https://recovery.preventionweb.net/media/81899/download?startDownload=20240711
Hassaballah, K., Mohamed, Y., Uhlenbrook, S. 2016. Investigation of the long-term variations in hydro-climatology of the Dinder and Rahad basins and its implications on ecosystems of the Dinder National Park, Sudan. Hydrol. Earth Syst. Sci. Discuss., doi:10.5194/hess-2016-407
Mueller, N., Lewis, A., Roberts, D., Ring, S., Melrose, R., Sixsmith, J., Lymburner, L., McIntyre, A., Tan, P., Curnow, S., & Ip, A. (2016). Water observations from space: Mapping surface water from 25 years of Landsat imagery across Australia. Remote Sensing of Environment, 174, 341-352.
OCHA. 2022. Sudan Humanitarian Update, September 2022 (No. 08). Link: https://reliefweb.int/report/sudan/sudan-humanitarian-update-september-2022-no-08. 30 September 2022
Reliefweb. 2024. Sudan: Collapse of Arba’at Dam in Port Sudan, Red Sea State Flash Update No. 02 (29 August 2024) [EN/AR]. Link: https://reliefweb.int/report/sudan/sudan-collapse-arbaat-dam-port-sudan-red-sea-state-flash-update-no-02-29-august-2024-enar
Tohami, A. E. A. 2019. Seasonal Flood in Sudan and its Environmental, Health and Socieconomic Impacts on the Livelihoods. Review of A Five-Year Period. Americal Journal of Biomedical Science & Research. 2019 - 5(4). DOI: 10.34297/AJBSR.2019.05.000931.
UN-SPIDER, webpage, https://www.un-spider.org/advisory-support/recommended-practices/recommended-practice-flood-mapping/in-detail, visited 11.07.2024
Notes
[1] The Arbaat Dam collapsed in August 2024
[2] see Appendix for all available dates. Due to cloud cover these data were downloaded for further analysis: 8. August; 2. and 10. September; 4. and 28. October and 29. November 2022
[3] 16. and 28. August, 2022 and 21.09.2022; Image IDs: S1A_IW_GRDH_1SDV_20220816T032506_20220816T032531_044572_0551D5_129F; S1A_IW_GRDH_1SDV_20220828T032507_20220828T032532_044747_0557C0_DB8A; S1A_IW_GRDH_1SDV_20220921T032507_20220921T032532_045097_056388_2B82
